Linear interpolation estimates a value between two known data points. This guide shows the calculation, a spreadsheet formula and a reusable VBA approach.
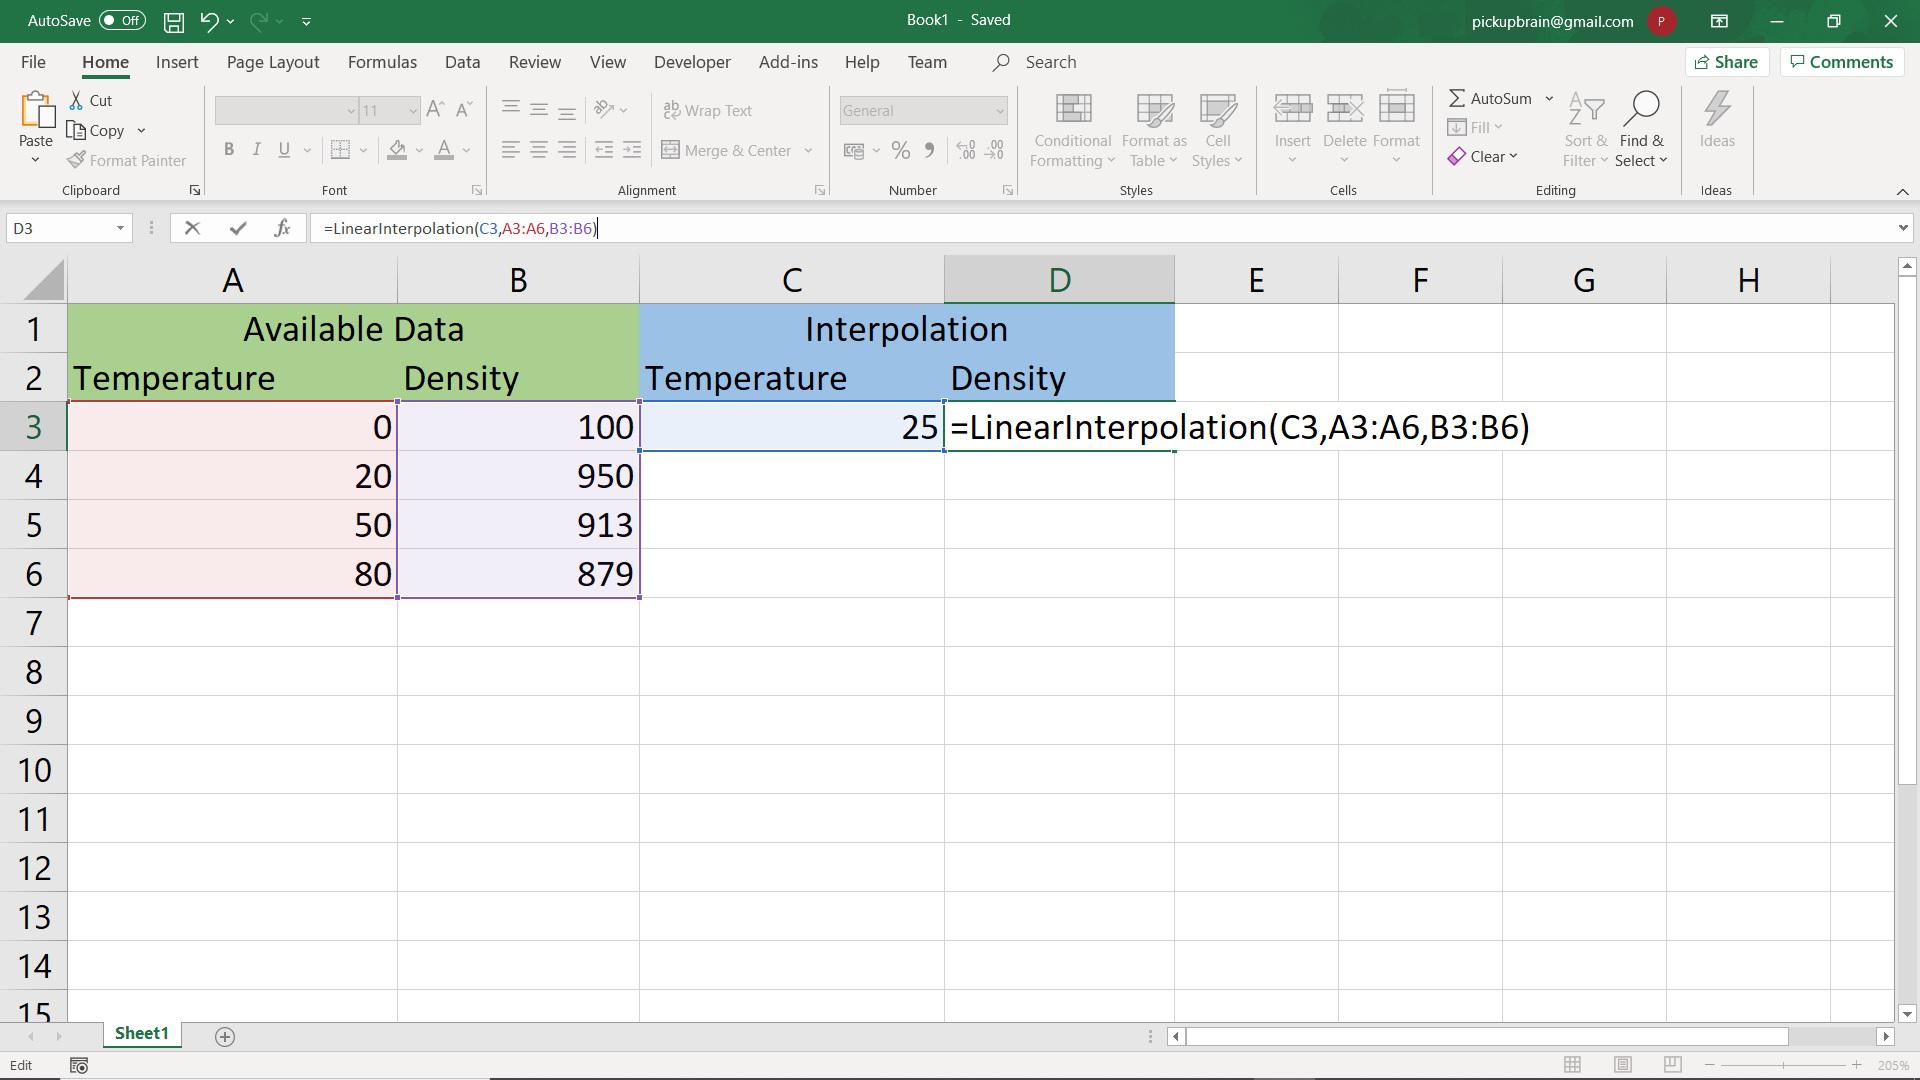
Let us consider the following example. We have of density of water at different temperature. Using this data, we need to find density at intermediate temperature, say 25°C or so. One simple method is to use density at the 20°C and 50 °C to estimate value at the intermediate temperature of 25°C using linear interpolation.
| Temperature (°C) | Density (kg/m3) |
| 0 | 1000 |
| 20 | 950 |
| 50 | 913 |
| 80 | 879 |
Interpolation in Excel
Linear Interpolation
Following interpolation steps describes how to estimate specific heat at 25°C from the above known data.
- Step 1: Finding nearest lower and upper known data, i.e. density at 20°C (x1) and 50°C (x2) is 950 (y1) and 913 (y2) kg/m3.
- Step 2: Interpolating value (y) at 25°C (x) using


Visual Basic function for Linear Interpolation in Excel
Once the nearest lower and upper known data, writing interpolation function is is easy.
Following code Visual Basis function (LinInterp) takes known x and y values in variable x_values and y_values along with x where we need to calculate y using interpolation.
Function LinearInterpolation(x, xvalues, yvalues)

x1 = Application.WorksheetFunction.Index(xvalues, Application.WorksheetFunction.Match(x, xvalues, 1))
x2 = Application.WorksheetFunction.Index(xvalues, Application.WorksheetFunction.Match(x, xvalues, 1) + 1)
y1 = Application.WorksheetFunction.Index(yvalues, Application.WorksheetFunction.Match(x, xvalues, 1))
y2 = Application.WorksheetFunction.Index(yvalues, Application.WorksheetFunction.Match(x, xvalues, 1) + 1)

LinearInterpolation = y1 + (y2 - y1) * (x - x1) / (x2 - x1)

End Function
Writing user defined Interpolation function in Excel
To make the above LinearInterpolation function available in excel like other functions, you need to carry out the following steps:
Step 1: Open Visual basic Editor
If developer tab is not available in your Excel, you need to go to Files > Options, click Customize Ribbon and check the box against Developer in Main Tabs. This will activate Developer tab in your Excel.
Now, Open Visual basic Editor by navigating to Developer tab > Visual Basic
Step 2: Create Module
To create new Module, navigate Insert Tab and click Module. This opens up a new window where you can write Visual Basic Code.
Step 3: Write LinearInterpolation Function
Now, copy the LinearInterpolation code written above into the newly opened Modules window and then close the module window and visual basic editor window.
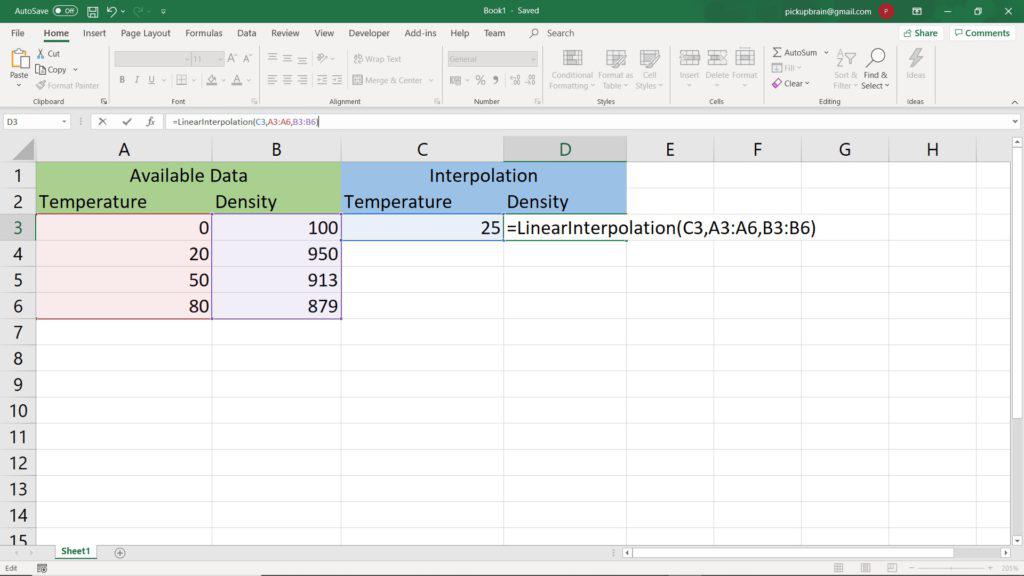
Now, you can test LinearInterpolation(x, xvalues, yvalues) function in current Excel Workbook, where x is the value for which we need to estimate y using interpolation on data which has xvalues and yvalues. Currently, the above function is only available for the present workbook.
Step 4: Save Excel as Addin to make it available to every one
Saving the current file as Addin is an important step to make it available to every Excel workbook. Save the current workbook as “Excel Addins” in the default folder which Windows prompts with the name “LinearInterpolation Function.xlam”. We will use this file name in the last step.
Activating Excel Addin for Linear Interpolation
This is the last step of the process. It will make sure that LinearInterpolation function is available to every work book in the system. This is done by activating Excel Addin we made.
To activate add-in, navigate Files > Options > Add-in and select line ending with “LinearInterpolation Function.xlam” from the list of Inactive Add-in and click Go.
Enjoy!!!!

Summary
We have successfully created Add-in for linear interpolation and activated it for use in every Excel Workbook. This interpolation function takes, x (e.g. temperature) where the value of y (e.g. density) needs to be interpolated and list of know xvalues and yvalues. The only condition is that x values should be sorted in ascending.
Updated step-by-step guidance
Given (20,950) and (50,913), the estimate at x=25 is 950+(25-20)*(913-950)/(50-20)=943.8333. With x1 in A2, y1 in B2, x2 in A3, y2 in B3 and target x in E2, use =B2+(E2-A2)*(B3-B2)/(A3-A2).
Troubleshooting and important limitations
The density figures used here are illustrative, not validated engineering data. Interpolation assumes approximate linearity between points. Avoid division by zero when x1=x2; extrapolation beyond the range is less reliable. Check custom VBA functions for sorted inputs and bounds.
Related: PickupBrain tutorial.

C P Gupta is a YouTuber and Blogger. He is expert in Microsoft Word, Excel and PowerPoint. His YouTube channel @pickupbrain is very popular and has crossed 9.9 Million Views.
Pingback: How to convert text to formula in Excel - Wisdomiseme